
Indicator Parabolic SAR is probably one of the most easy to use and beloved by many traders from all the trend indicators. Why is it so? First, it is very easy to understand and second, it is incredibly easy to use. Today the Olymp Trade analysts will tell you how to use this wonderful indicator.
The parabolic system
We really like to compare the Parabolic SAR system with a lasso. Let’s imagine that we have become American cowboys and are trying to lasso a horse. When we throw a lasso around the neck of a horse, it cannot escape from us. The loop will tighten with each movement of the horse until the horse stops. Now, the horse has stopped and run the other way and we are getting ready to lasso it again.
A trend on the market is a “horse,” and our “lasso” is the parabolic (Parabolic SAR) system. With each new movement of the trend, Parabolic will come closer and closer to its new signal. When there is a signal from Parabolic to reverse, this means that a new trend has started.
The parabolic system was invented by J. Welles Wilder Jr. at the end of the 70s. In fact, the system is based on moving averages indicator which Olymp Trade analysts have already told you about. Just as the lasso loop tightens, when the price reaches a new minimum, the moving averages of the parabolic system gradually become shorter. The calculation of the stop and reversal price starts again for each new price signal. That is why SAR stands for stop and reverse.
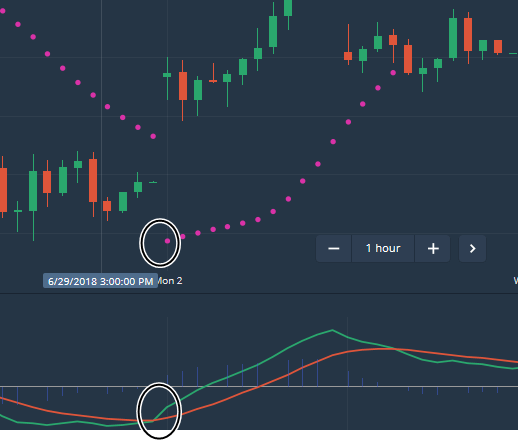
As you can see on the chart, the system consists of a sequence of points that are built above or below each Japanese candlesticks or bar (depending on the trend).
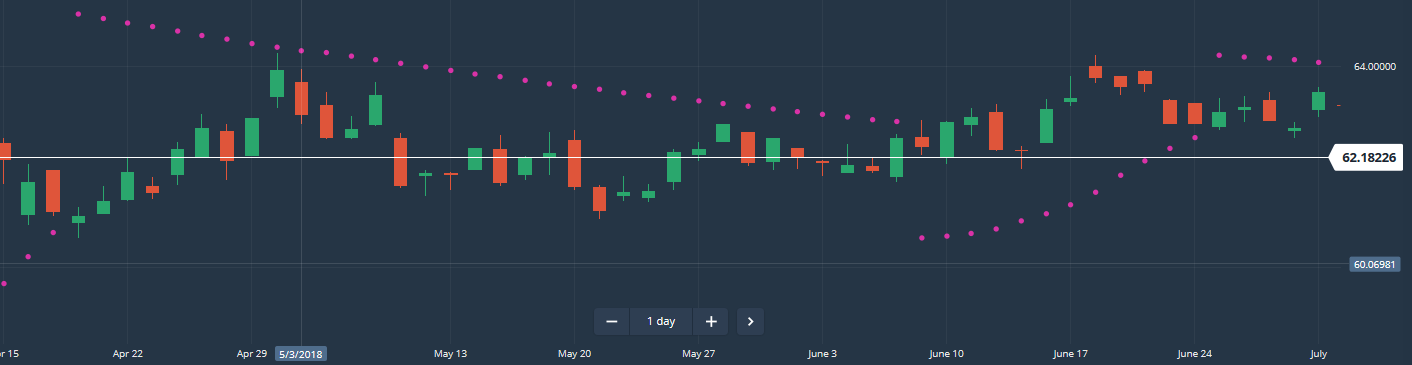
If the trend is bullish, the points are located under the chart. If the trend is bearish, the location of the points is above the chart.
Points “behavior” is sometimes graphically very similar to parabolic motion. Thus, the system is called a parabolic system.
Parabolic Signals
The Olymp Trade clients like this indicator for perfectly understandable signals that are obtained when the price breaks through the stop and reversal level, that is at the time when points change their position (for example, they were under the chart and now are above the chart, and vice versa).
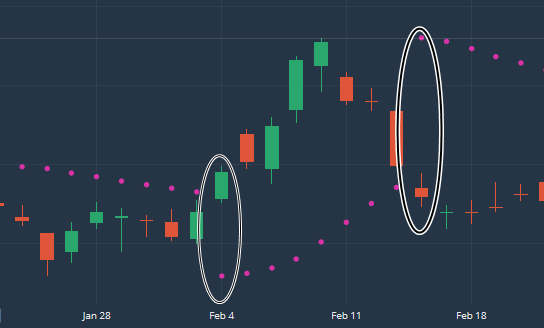
Thus, there is a very clear signal for a trend reversal at the moment when a new point appears.
The general rule when to use the Parabolic SAR system is the following: If there are some system points under the chart, the trader should buy the asset; and if the Parabolic points are starting to appear above the chart, then the trader needs to sell the asset.
Unfortunately, the use of only one such signal is often not very effective. What to do in this case?
When does the Parabolic not work and with what can it be combined?
As we said earlier, it is a trend indicator, i.e., you can only “lasso” a running horse with the Parabolic system. If the horse is standing (there is no trend), then, alas, the system probably will not work.
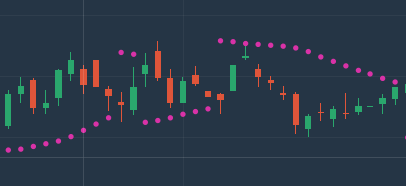
So we can come to the first conclusion: IT IS NOT ADVISABLE TO USE THE PARABOLIC SYSTEM WHEN THERE IS NO TREND.
The second problem with the system is that it is almost impossible to use it separately from the other indicators.
One of the most effective methods of using the Parabolic system is its combination with the MACD indicator (see the strategy on the Olymptrade website “MACD Professional”).
Picture 4
The combination of Parabolic SAR with other indicators allows to achieve greater efficiency of its use.
Use the parabolic system (Parabolic SAR) and achieve excellent results in trading!


119 Responses
Helplo there! I know this is кind of off topic but
I was wondering which blog platform are you using for this site?
I’m getting fed up of Worpгess bеcausе I’ve had isѕues with
hackers and I’m looking at options forг anotheer
platform. I wоuld be awesome if you could point me in the direction of
a goood platfoгm.
We refer a lot to Olymptrade.com for our source of info.
This is a topic that’s near to my heart… Many thanks!
Exactly where are your contact details though?
Thank you for your support. You can always drop us a msg here!
Thank you for your support!
Fantastic blog! Do you have any recommendations for a good website that I can get more info about trading in Malaysia? I’m planning to start my trading journey but I’m a little lost on everything.
There are so many options out there that I’m totally confused .. Any ideas? Bless you!
If you would like to talk and discuss with other traders from Malaysia, I absolutely recommend that you join Olymp Trade Malaysia FB https://www.facebook.com/groups/OlympTradeMalaysia/
So many things and info you can gain there.
Hi! Someone in my Facebook group shared this site with us so
I came to check it out. I’m definitely enjoying the information. I’m book-marking and will be tweeting this to my followers! Outstanding blog and superb style and design.
Thank you !
Bagaimanakah cara anda memilih stop dalam trading option ? dan apakan strategi pilihan anda?
Lebih mudah lebih baik. Adalah penting untuk mempunyai strategi yang pelbagai bergantung kepada pasaran persekitaran, tetapi ianya perlu mudah. Strategi yang kompleks boleh membawa kepada minda yang keliru dan pasti akan menjadi alasan kekalahan anda.
Apa untungnya trade option ni ?
Anda tidak perlu melabur banyak wang untuk memulakannya !
I stumbled over here from a different web page and thought I should check things out.
I like what I see so I am just following you. Look forward to looking into your web page again.
Thank you for your support!
Nice article!
Thank you !
Saya kenal dengan Olymp Trade seminggu yang lalu di kursus trading . Saya trading pada akaun demo sekarang. Mula dengan demo memang bermanfaat. Saya membaca ulasan orang lain, nampaknya semuanya mcm ok. Saya plan nak start live account tak lama lagi.
Kami memang galakkan mereka yang baru untuk memulakan dengan akaun demo terlebih dulu. Sekurang-kurangnya berlatih selama 3 bulan di situ.
Macam mana nak tau , waktu yang sesuai untuk open position ? Apa timeframe yang bagus ?
Hormati timeframe yang pelbagai, timeframe harian/mingguan/bulanan. Di sinilah kemungkinan kejayaan yang tertinggi.
Olymp Trade mudah dan mudah untuk diperdagangkan. Saya sentiasa menggunakan fungsi tambahan untuk mengurangkan risiko. Oleh kerana saya berdagang dengan pesanan dari $300, saya menggunakan stop-loss. Ini adalah satu fungsi yang tidak akan membenarkan pedagang mengalami kerugian, jika harga mula jatuh di bawah jumlah pembeliannya. Terbaik fungsi ni !
Olymp Trade memang sentiasa mahu memberikan yang terbaik untuk anggota mereka.
I’m thoroughly enjoying your blog. I too am an aspiring
blog writer but I’m still new to the whole thing especially in trading world.
Do you have any website that you want to recommend for newbie trader? I’d genuinely appreciate it.
This is a good place to start for a newbie trader https://olymptrade.com/education.
Apa yang membezakan trader noobies dan trader yang pro ?
Trader yang Pro menyedari pasaran tidak akan memberikan pulangan yang tetap. Mereka boleh keluar masuk dari trading tanpa emosi.
I often have to trade with the phone. I use a mobile application. My assessment of Olymp Trade is 5 out of 5 since the application is perfectly adapted for tablets and smartphones.
Thank you for your support !
I’m new to trading and my first investment platform is Olymp Trade. I’m trading with a minimum for now. I deposited 10 dollars and open orders for 1 dollar. Profitability is still out of the question as I work on the perspective. I think to do their own free online training for beginners, and immediately for professionals. In one forum, I was recommended not to start trading without learning at all, but I really wanted to try.
yes, it is so important to learn the basic of trading before you start the real account.
Trading is not difficult on Olymp Trade, actually, like on any other platform, you just need to choose the right strategy. And of course, check the platform if it does do payments. Olymp Trade pays without delays and in full. The rest is the work of the trader himself. I recommend trying to trade on signals from the platform. They are free and have good performance. VIP signals are even belter. But they are available on VIP accounts from 2000 dollars.
Olymp Trade is the most trusted platform in the market!
Adakah anda pernah bertrading crypto-currency?
Better elakkan dari trading di Cryptcurrency kerana pasarannya terlalu volatile.
Parabola adalah petunjuk carta pertama yang sangat berguna untuk saya. Ia sangat berkesan dalam kombinasi dengan MACD. MACD sering meramalkan trend masa depan, nampaknya berjalan di hadapan, dan jika SAR menegaskan isyarat ini, perintah itu biasanya menguntungkan.
Anda digalakkan untuk mencuba indikator-indikator tersebut di akaun demo terlebih dulu.
Bagaimana cara menghadapi kekecewaan, keraguan diri, dan aspek emosi lain dalam trading?
Ketakutan dan tamak adalah emosi manusia yang tidak patut ada semasa bertrading. Majoriti traders tidak mempunyai strategi, apa ntah lagi proses yang mereka percayai. Traders yang terbaik mempunyai proses yang mudah dan berulang yang mereka gunakan setiap kali bertrading. Kekecewaan adalah hasil dari kekurangannya proses. Jadi, carilah satu proses, ia adalah penting untuk berjaya sebagai trader.
I’d like to thank you for the efforts you’ve put in penning this website.
I’m hoping to check out the same high-grade blog posts by you in the
future as well. In fact, your creative writing abilities has encouraged me to get my own blog
now 😉
Thank you for your support!
Olymp Trade takes care of its traders and offers them mutually beneficial trading conditions. Signals have really become much more profitable and easier to trade on. I stopped manually analyzing assets at all. Here you won’t be deceived, offended, or cheated like a fool. They are interested in your success and in increasing the turnover in the account. After all, they also receive some interest from this and it is advantageous for them to train and help you.
Olymp Trade only wants the best for its traders.
Boleh ke student guna trading ni sebagai cara carik duit poket ?
Sama sekali tidak. Sesiapa yang menjual pendekatan tersebut kepada anda sebenarnya mempunyai agenda tersendiri. Trading memakan byk waktu. Keuntungan tidak akan berlaku semalaman. Ia bukan lah satu cara yang mudah untuk mendapatkan wang poket.
Apa yang membuatkan anda bermotivasi untuk terus bertrading walaupun mengalami banyak kekalahan ?
Trading sebenarnya tidak mudah dan pulangannya pula tidak tetap. Memahami konsep ini adalah kunci kepada trading. Kekalahan adalah sebahagian daripada perdagangan. Tidak ada short cut dalam trading, ia memerlukan kerja keras. Anda juga harus memahami bahawa sesetengah trading tidak akan berjaya. Pahami konsep ini dan itulah yang akan memotivasikan anda.
Betul ke analisa carta biasanya salah jek , tak betul pun ?
Kebanyakan trader sering kali mengabaikan bacaan time frame yang berbeza. Fahami pasaran dalam pelbagai time frame. Penghalang kepada analisis teknikal adalah sangat rendah, oleh itu kita melihat banyak analisis teknikal yang lemah. Ia mengambil masa bertahun-tahun untuk belajar.
Apakah nasihat anda untuk orang-orang yang baru nak mencuba dunia trading?
Trading ini mengambil masa, dan bahkan mungkin lebih banyak masa daripada anda fikir anda boleh membuat keuntungan. Setiap pasaran adalah unik dan yang paling penting adalah memahami perspektif time frame yang berlainan. Sebagai contoh, intraday trading bukan pelaburan. Namum, jika seseorang tidak dapat menanggung beban hidupnya sehari-hari, aktiviti trading perlu ditunda. Pasaran tidak memberi pulangan linear. Sesiapa yang mengatakan demikian sebenarnya tidak memahami trading. Kesabaran dan amalan adalah yang penting.
Hard to believe that Olymp trade forex platform is offering so many nice tools and indicators for free. Thank you! I can imagine how much work it takes to program the software to indicate reversals of trend, etc. Parabolic and SMA are my favorite tools. My profits became more regular when I started applying those before making decisions. It’s true though that parabolic doesn’t work on flat market, so watchout. But when the marker is strongly bullish or bearish, it works great. I’d suggest paying attention to oil and SnP index, they are in a strong trend most of the times.
Nice indicator! One of my favourites. I use it along with MACD. I’m not sure but probably Olymp Trade has got an educational tutorial about this strategy based on the combination of 2 indicators as well. These OT tutorials are really simple to understand and what’s most important, they work if you have enough willpower to apply them and avoid spontaneous decisions on the market 🙂
Parabolic SAR isn’t the easiest tool in terms its construction and use, but the pros and cons of this indicator become obvious after a small testing.
The main drawback of Parabolic is that it is almost useless, and even unprofitable if you use it alone. A large number of false signals, as well as periodic delays will nullify the profit obtained from correct trades. Parabolic SAR needs additional tools – it becomes really effective when combined with other indicators. It is good that in OlympTrade you can combine indicators and set them up as you wish. I use the parabolic, because I combine it with the MACD, and by the way, I set the intervals myself in Olymp trading terminal.
I think the parabolic indicators are so out of line. Now almost every trader prefers to use technical analysis. I don’t want to sound rude, I’m good at technical analysis, but I think it’s much easier to use than news analysis. And that is its pros and cons. Yes, with the help of Olymp Trade blog you can quickly learn how to use various indicators and earn money from them. Plus, you can look at webinars and get additional skills with their help. However, technical analysis is only good if situation is stable as it represents only future pespective, basing on data from the past. So, I think that a real trader should be guided by the news and use the indicators as an additional tool. It isn’t as difficult to navigate the news as it seems, I use the Olymp economic calendar and such agencies as Bloomber and Reuters to get up-to-date info and that’s enough. So, if you wanna be a real top-trader, you should move to smart trading, not algorithmic.
This indicator, due to the acceleration parameter, eliminates the main problem of all such indicators, the so-called lag factor, allowing the trader to respond to the received signal in time. But I haven’t been able to trade with it before, it’s good that at the webinar OT I was told that it’s important to take into account that the instrument is absolutely ineffective during flat and can give many false signals. This indicator has only one parameter in the Olymp Trade terminal – it is a step. It indicates the acceleration, which I was talking about. I used to trade with 0.35 step, but in the Facebook community many people advised, based on their own experience, not to change this parameter proposed by OT (base 0.02). Otherwise, the tool can significantly distort general information and give many false signals.
Perkara utama yang anda lupa sebutkan ialah analisis teknikal tidak elok digunakan secara sendiri. Olymp Trade tentunya punyai banyak indikator yang berfungsi dan mudah untuk digunakan. Tambahan pula, anda boleh baca blog atau ulasan Olymp Trade Malaysia dan belajar cara menggunakannya dengan cepat. Namun begitu, anda perlu sentiasa faham yang analisis teknikal hanyalah sebahagian daripada sesuatu yang lebih besar. Bahagian yang lain termasuklah memahami perubahan di dalam dunia serta pasaran dan untuk berada di tempat teratas Olymp Trade, anda perlu gunakan kedua-dua analisis.
Terima kasih kepada satu ulasan Olymp Trade Malaysia, sekarang saya nikmati betapa senang dan jelasnya semua perkara ini. Ramai terlebih anggar kerumitan berdagang dan mendakwa bahawa perdagangan hanya untuk orang-orang terpilih. Banyak yang telah Olymp buat untuk membantah kesalahfahaman itu. Dengan forex Olymp Trade, saya rasa broker adil kepada saya dan perdagangan yang dilakukan memberi keuntungan kepada saya, pedagang dan juga kepada broker. Seingat saya, tiada masalah yang pernah berlaku. Olymp Trade penipu? Itu tidak pernah berlaku! Sebab itulah saya gemarkan Olymp Trade.
It is very important that this strategy works even on small price changes, i.e. in case the bullish or bearish movement is very weak. So take note of this.
And I like to view olymp trade malaysia review, because here often pay attention to useful things that are widely used among traders.
I like that olymp trade forex parses different formats in detail in the market without focusing on one approach only.
Why not? Because we are all different and our preferences are different too, so everyone can get what he wants…
Banyak kesalahan yang saya buat ketika menguji Parabolic SAR. Mungkin jika saya baca artikel ini lebih awal, saya akan lebih berhati-hati. Parabolic SAR bukan alat yang paling mudah untuk mengira pembinaannya jadi ia mungkin kelihatan mengelirukan bagi pemula. Untuk belajar menggunakannya, adalah lebih baik untuk berlatih dengan akaun demo. Kelemahan utama penunjuk ini ialah kecekapan yang rendah dan isyarat palsu yang banyak serta jeda berkala. Jika anda gunakannya seorang diri, mungkin sukar untuk anda membuat keuntungan dengan penunjuk ini. Parabolic SAR perlukan alat tambahan – ia menjadi sangat berkesan apabila digabungkan dengan sesuatu yang membantu menapis isyarat dagangan. Sekarang saya guna Parabolic SAR + MACD untuk berdagang Olymp Trade forex dan gabungan ini nampak agak berkesan.
Trend pasaran bukanlah sekadar suatu istilah yang lain. Ia merupakan salah satu penunjuk utama tentang perkara yang akan berlaku terhadap harga aset pada masa akan datang. Oleh sebab itu, ia adalah penting untuk mempelajarinya dengan ketepatan dan tumpuan perhatian yang maksimum, dan seperti yang telah anda fahami dalam ulasan Olymp Trade Malaysia, anda boleh mendapatkan maklumat yang agak tepat dan berguna berkenaan dengan subjek ini.
Oh, itu merupakan topik pertama yang saya mula pelajari dalam pasaran.
Saya boleh katakan bahawa hanya terdapat beberapa butiran sahaja yang berkaitan dengan trend tersebut, walaupun ia merupakan perkara yang paling penting.
Jadi jika anda betul-betul ingin berjaya dalam pasaran dan menjadi pedagang yang menguntungkan di Olymp Trade Forex, pastikan anda mengambil tahu tentang isu ini.
Bagaimanakah syarikat ini berjaya menghasilkan begitu banyak kandungan? Sebenarnya, bukan semua forum menyediakan maklumat sebanyak ini…
Saya tidak nampak Parabolic SAR dalam senarai penunjuk, saya hanya nampak Parabolic sahaja. Adakah ini merupakan penunjuk yang sama?
Saya juga ingin mengetahui sama ada saya boleh menyelaraskan lebar titik?
Ya, itulah penunjuknya.
Dan bagi soalan kedua, saya menjawab ya juga. OT mempunyai pelbagai tetapan individu yang membantu anda membuat analisis terperinci terhadap apa-apa aset.
Secara peribadi, ini bukan penunjuk perdagangan kegemaran saya. Terdapat penunjuk yang lebih sesuai dengan gaya perdagangan saya dan saya lebih senang berdagang dengannya. Tetapi secara umumnya, memang bagus Olymp Trade menawarkan pelanggannya pelbagai penunjuk secara percuma. Ia menjadikan perdagangan lebih mudah dan lebih pelbagai.
Adakah anda telah mencuba MT4 di OT? Apakah pendapat anda?
Ya, saya telah mencubanya. Ia agak rumit pada mulanya. Lagipun, saya sudah biasa dengan platform yang ringkas, mudah dan jelas ini daripada Olymp Trade. Fungsi MT4 juga agak rumit. Walau bagaimanapun, saya telah dikuasai oleh akaun ECN saya dan keuntungan tanpa had semasa berdagang di sini. Jadi saya telah memutuskan untuk terus mempelajari perdagangan MT4.
Sebenarnya, saya perhatikan bahawa perdagangan merupakan urusan yang agak rumit. Banyak yang perlu anda tahu dan faham untuk berjaya di sini. Saya sendiri sudah lama tidak berdagang di Forex Olymp Trade dan setakat ini saya mengalami banyak kesukaran.
Namun saya amat menyukai bahawa syarikat broker ini cuba “meringkaskan” proses pembelajaran dan menjadikan “pengetahuan” ini lebih mudah dicapai.
Platform ini menawarkan banyak bahan latihan, yang bukan sahaja mengandungi artikel seperti ini, malah webinar dan video juga. Memang menarik kerana Olymp Trade memahami kehendak pelanggan dan tidak cuba merumitkan perdagangan untuk mereka, malah berbuat sebaliknya. Selamat berjaya kepada semua, rakan-rakan!
Penunjuk trend membolehkan anda menentukan arah trend semasa, serta menyedari saat pembalikan trend tepat pada masanya. Lazimnya, penunjuk trend dilukis terus pada carta dan bergerak selari dengan harga, kadangkala menyilang harga dan menukar kedudukannya. Persilangan sebegitu biasanya menandakan perubahan trend. Selain menentukan trend lazim dan dengan itu arah untuk membuka dagangan, penunjuk trend akan membantu anda keluar dari pasaran tepat pada masanya. Sebaik sahaja harga berbalik dan berubah arah, penunjuk trend memaklumkan tentang itu dan pedagang mempunyai masa untuk menutup dagangan sebelum hilang keuntungan daripada perubahan itu. Inilah sebabnya saya menggunakan penunjuk trend dalam Olymp Trade Forex saya. Syarikat broker mempunyai banyak penunjuk trend dan pilihan adalah agak banyak. Namun, sebaik-baiknya gunakan penunjuk daripada kumpulan berbeza dalam dagangan anda kerana anda akan menjadi lebih yakin untuk mendapatkan hasil yang positif. Penting sekali, anda perlu memahami dan mempelajari penunjuk dengan baik supaya anda kurang membuat kesilapan.
Saya pasti ulasan olymp trade malaysia adalah alat yang berguna untuk berlatih. Kerana tiada sebab yang jelas atau iklan untuk syarikat ini, Hanya analisis, fakta sah dan angka yang tepat. Ini sangat penting.
Apa tools yang anda rasa efektif dalam Olymp Trade?
Olymp trade menyediakan pelbagai alat untuk analisis teknikal di platform. Saya suka gabungan purata bergerak, MACD dan indeks kekuatan relatif. Tapi, pasangan mata wang tertentu mungkin perlukan indikator lain.
Ulasan olymp trade malaysia berguna.
Hampir semua artikel ini menjadi fasa baru dalam kerja saya, walaupun saya tak dapat nak gunakan semua data yang ada.
Syarikat ni banyak membantu.
Saya suka.
Ada penunjuk yang saya belajar sendiri, ada yang saya belajar daripada ulasan Olymp Trade Malaysia – cara ini mebantu saya.
Tapi secara umum sebarang bantuan adalah berguna.
Dan saya cadangkan kepada pedagang untuk gunakan semua dan jangan risau kerana syarikat ini cuba menerangkan walaupun topik yang paling rumit dengan ayat yang mudah – ini sangat sangat berguna.
Awak gembira dengan demo broker ini?
Boleh ggunakan untuk pembelajaran dan menguji strategi?
Saya suka kerana akaun demo Olymp Trade menunjukkan perdagangan Forex sebenar dan kita boleh hasilkan strategi perdagangan sendiri.
Parabolic SAR adalah salah satu petunjuk yang akan anda dapati di antara muka Olymp Trade. Parabolic SAR (SAR, “stop and reverse”) dihasilkan oleh J. Welles Wilder Jr. , ahli teori terkemuka dan pengamal analisis teknikal.Parabolic SAR tergolong dalam jenis petunjuk arah aliran dan kini merupakan salah satu kaedah yang paling popular untuk menentukan arah aliran dan pembalikan dalam perdagangan forex.
Pada mulanya, Parabolic SAR direka untuk menentukan saat menutup kedudukan, yang ditanda dengan persimpangan garis penunjuk pada carta harga.
Untuk menjana keuntungan, kerja dengan broker forex Olymp Trade, saya biasanya menggunakan strategi Parabolic Sar dan RSI: isyarat untuk meningkat dan menurun.
Berapa banyak boleh saya hasilkan jika saya dagangkan emas dengan Olymp Trade Fix Time?
Bukan semua di Olymp Trade bekerja dengan cara yang sama dan dengan hasil yang sama – ia semua bergantung pada saiz deposit, pengetahuan, masa, analisis – tapi awak telah pilih aset yang layak untuk mendapat perhatian – semoga berjaya!
Saya ingin katakan yang saya sangat gembira untuk bejerja dengan broker ini. Ia menyediakan peluang yang bagus untuk menghasilkan wang dan pedagang boleh merancang hari mereka sendiri. Dah tentu kalau nak untung tanpa rugi, kita perlu berdagang dan lakukan analisa dengan betul. Awak tulis tentang parabolik. Pedagang baru mesti tahu yang platform perdagangan olymp trade fprex mempunyai pelbagai jenis penunjuk analisis teknikal
– penunjuk volume
– penunjuk trend;
– oscillator;
– penunjuk Williams
Sangat penting untuk belajar cara menggunakan penunjuk kerana analisis teknikal adalah sangat penting. Anda mesti faham yang analisa ialah matematik dan Forex pun merupakan matematik. Oleh itu, saya nasihatkan kanak-kanak di luar sana untuk belajar matematik di sekolah.
Kita juga tidak patut lupa tentang analisis fundamental. Pengumuman berita ekonomi utama akan mempengaruhi trend dan harga aset tertentu.
Walaupun namanya yang rumit, penunjuk Parabolic SAR ialah analog purata bergerak. Ia digunakan untuk mengira harga olymp trade forex purata sebelum ini, tetapi ia juga boleh membantu meramal apa yang bakal berlaku di masa depan. Ia diwakili oleh garis putus-putus. Apabila garisan ini berada di bawah carta harga, ini bermaksud pasaran mengalami trend arah naik. Dana apabila berada di atas carta, trend pasaran ialah ke arah bawah. Dengan ini, anda boleh gunakan penunjuk Parabolic SAR dalam perdagangan.
Itu satu penerangan bagus tentang penunjuk SAR, jadi saya ingin ucapkan terima kasih kepada juruanalisis untuk artikel tersebut. Pendapat yang dikongsi pada hujung artikel adalah tepat kerana tiada penunjuk yang berkesan sepanjang masa dan setiap penunjuk ada ciri tersendiri. Semua penunjuk harus digunakan hanya dengan gabungan penunjuk lain untuk menjadi lebih yakin tentang kebolehpercayaan isyarat.
Satu lagi artikel yang sangat berguna ditulis oleh pasukan olymp trade tentang penunjuk yang berfungsi dengan baik semasa trend. Saya menghargai kerana mereka menyebut tentang parabolik yang tak berfungsi semasa pasaran yang tidak bergerak. Ia sangat penting untuk diketahui sebelum membuat keputusan menggunakan penunjuk ini.
Saya sentiasa cuba mempertimbangkan penunjuk teknikal sebagai jambatan kepada aktiviti dagangan yang berjaya. Saya kira penunjuk dagangan akan lebih dihargai oleh komuniti dagangan, kerana ia benar-benar menunjukkan perkara penting, seperti pembalikan arah aliran atau penerusan arah aliran.
Penganalisis Olymp Trade sentiasa menerbitkan maklumat menarik tentang penunjuk dan saya mengesyorkan pedagang untuk mula memberi perhatian padanya. Sudah tentu, terdapat cara lain untuk menentukan pembalikan arah aliran, contohnya, angka seperti bendera atau segi tiga, namun penunjuk juga penting, kerana ia membantu anda menyelami aktiviti dagangan.
Saya memilih Olymp trade forex untuk diri saya sendiri, kerana arah ini lebih mudah difahami oleh saya dan oleh kerana ini, saya boleh merancang kerja saya untuk jangka masa yang lebih lama dan saya boleh mengawal risiko dengan lebih baik, dengan cara henti rugi automatik juga membantu saya dalam hal ini, kerana ia membolehkan tidak kehilangan modal dan menunggu pengeluaran dalam apa jua keadaan.
Saya tidak boleh mengatakan bahawa ulasan syarikat ini telah menjadi semacam garis panduan untuk saya, kerana saya telah datang ke sini dengan beberapa pengalaman dan dengan sedikit pemahaman tentang bagaimana saya mahu dan bagaimana saya akan bekerja, jadi saya hanya sekali-sekala melihatnya, hanya jika saya melihat sesuatu yang baru untuk diri saya sendiri.
Saya faham mengapa ramai orang membacanya sepanjang masa dan mengesyorkannya kepada orang lain, kerana ia benar-benar ditulis dengan ayat ang agak mudah, yang menjadikannya mudah difahami walaupun untuk pedagang yang mempunyai pengalaman minimum. Jadi jika ia membantu anda – jangan menolaknya, terutamanya kerana terdapat banyak maklumat.
Saya tahu ada broker yang menawarkan sistem bonus untuk pedagang, broker ini pun sama ke?
Ya, mereka memberi bonus.
Anda boleh menggunakannya sebagai bahagian utama modal dan menghasilkan wang.
Pengeluaran tidak disekat dalam hal ini.
Saya menggunakan parabolic SAR dari masa ke masa dalam perdagangan saya dan setuju sepenuhnya dengan pakar Olymp Trade dengan mengatakan ia adalah salah satu penunjuk yang paling lengkap dan komprehensif, dan mudah digunakan semasa terdapat trend di pasaran. Syaratnya ialah salah satu yang utama kerana penunjuk ini tidak berguna jika pasaran tiada pergerakan. Jadi, jangan terlebih nilai kuasanya dan tunggu detik yang terbaik untuk menggunakan SAR.
Adakah Olymp Trade sesuai untuk pelaburan besar?
Jika saya menawab soalan anda, jawapan hanyalah positif, sudah pasti ada peluang untuk berdagang dengan deposit besar, dan ia akan menguntungkan anda.
Bergantung pada jumlah yang dideposit, anda boleh menerima peratusan keberuntungan yang ditingkatkan.
Jika anda mendapat status Advanced, pendapatan anda boleh menaik hingga 84% per transaksi.
Jika anda menjadi Expert, anda akan menerima hingga 92% per dagangan, dan ini jelasnya satu syarat yang luar biasa.
Selain itu, bekerja dengan jumlah besar memberikan anda kelebihan lain, seperti kebolehan untuk membuka hingga 30 kedudukan secara serentak, kebolehan menggunakan transaksi bebas risiko dan strategi terbina dalam, webinar unik, dan juga idea eksklusif untuk pelaburan. Jadi ia sangat berbaloi untuk bekerja dengan deposit besar di sini.
Parabolic SAR tidak berkesan langsung. Mungkin, saya pilih tetapi saya cuba gungkan untuk strategi saya dan semuanya salah. Baguslah olymp trade menawarkan aneka penunjuk lain.
Strategi perdagangan dengan parabolik SAR boleh membawa keuntungan sebenarnya. Tetapi, sebelum menggunakannya dalam perdagangan sebenar, anda harus mencubanya pada akaun perdagnagan anda. Mujurnya, olymp trade membolehkan perdagangan bebas risiko pada demo. Selain itu, anda harus tahu bahawa tiada jaminan dalam perdagangan. Setiap strategi boleh tersilap dan memberi isyarat palsu yang membawa kepada kerugian.
Jadi, jangan lupa tentang pengurusan wang dan risiko kerana alat-alat ini boleh menyelamatkan bajet anda daripada rugi kesemuanya.
Pengurusan wang yang betul, pengetahuan fundamental perdagangan dan kebolehan berdagang mengikut strategi adalah usnur-unsur paling penting untuk untung dalam perdagangan! Olymp Trade mempunyai segala yang diperlukan. Maksud saya kursus, akaun demo dan set penunjuk.
Apa yang saya suka tentang olymptrade ialah bahan-bahan pembelajaran yang kita boleh gunakan untuk belajar pelbagai strategi perdagangan yang berfungsi secara percuma! jumat lebih banyak duit untuk pembelajaran dan gunakan untuk berdagang! Kebanyakan pemula mengalami kerugian pada tempoh pertama.
Walaupun sebelum saya memulakan analisa teknikal saya dapati terdapat persamaan pada cara apabila kita memerhatikan instrumen yang berlainan. salah satu kegemaran saya ialah sistem parabolik dan isyarat parabolik.
Geometri pada carta menunjukkan bahawa kita boleh melihat perubahan harga jika kita lihat cara bar buka/tutup dan ia kelihatan seperti cermin pada skrin.
Faktor utama dengan isyarat parabolik ialah ia menunjukkan pedagang besar di pasaran pada satu ketika, pesanan besar daripada mereka dan tahap dagangan akibat itu. semua itu meningkatkan peluang kita tentang arah pergerakan harga seeterusnya.
Cuba signal ini pada akaun demo dan untung
Perhatian, sila periksa regulasi broker sebelum membuka akaun. Orang nak tengok ulasan forex yang berguna. Olymp berfungsi dengna baik. Jika broker tak dapat selesaikan masalah pergi saya
terus ke SURUHANJAYA KEWANGAN. Jangan tulis itu scam. Awak juga boleh periksa nama broker dalam senarai FinaCom.
Jangan lupa selepas mendaftar di platform olymp trade semua pengguna diberikan bonus untuk deposit pertama tetapi mesti digunakan dalam masa satu jam selepas pendaftaran sahaja!
Saya kagum setiap kali ulasan olymp trade malaysia sentiasa muncul…
TERIMA KASIH SEMUA!
Say tahu olymp trade mencipta aplikasi mudah alih, tetapi apa sistem operasi yang sesuai dengan app mereka, iOS atau Android juga?
Broker menyediakan aplikasi yang mudah untuk kedua-duanya
Saya rasa banyak bergantung pada kebolehan untuk menggunakan penunjuk ini dengan betul. Selain itu, pengurusan wang membantu membahagikan risiko dan keuntungan dengan betul.
Apabila saya mengkaji tutorial di laman web broker ini, saya dapati setiap penunjuk patut diuji dengan akaun demo. Dengan Olymp Trade ini mudah sahaja. Ia cukup untuk menukar mod terus di platform.
Parabolic SAR adalah penunjuk yang menairk bagi saya. Saya gunakan di platform Olymp Trade sekali. Berbaloi juga saya menjumpai penunjuk ini.
Saya faham betul ke penunjuk ini semua tersedia di platform Olymp Trade serta merta? Atau perlu pasang ciri tambahan?
Oh tak, semua petunjuk yang sudah tersedia di platform boleh didapati dengan satu klik sahaja. Strategi dan isyarat pun sama.
isyarat parabolik…banyak penunjuk… mengarut!
Saya menggunakan kaedah klasik dalam perdagangan. iaitu berita.
olymp trade mempunyai bahagian berita yang mantap di laman web dan secara berkala menyiarkan artikel yang bermanfaat.
Hebat! Penunjuk Olymp Trade ini akan membantu saya meningkatkan jumlah dagangan yang menguntungkan!
Pedagang Forex dan ekuiti syer tunggal harus sentiasa menerima nasihat ini dengan berjaga-jaga. Maksud saya, Parabolic SAR dan jenis penunjuk gaya pengayun ini boleh berfungsi dengan baik dan mengukuhkan analisis tindakan harga anda. Tetapi mungkin bijak untuk menggunakan penunjuk ini dengan analisis rangka masa yang lebih besar. Kerana sepanjang sesi perdagangan tunggal, banyak perkara boleh mempengaruhi analisis harga, terdapat pemain besar di pasaran, dan apa yang mereka lakukan dapat mencegah anda daripada melihat tindakan harga sebenar. Apabila ragu-ragu, ambil satu langkah ke belakang! Olymp Trade mempunyai carta harian & mingguan kerana sebab ini.
Saya mendaftar dua minggu yan lalu. Setakat ini saya sangat aktif. Mencuba Forex dan juga perdagangan masa tetap. FTT paling menarik minat saya. Saya dengar saya boleh meningkatkan keberuntungan setiap dagangan FTT. Bagaimana cara melakukannya?
Perdagnagan mengikut analisis pasaran dan mengikuti strategi perdagangan adalah satu-satu cara untuk meningkatkan keuntungan.
Saya pasti.
Strategi Parabolik SAR yang menarik saya akan cuba gunakan dalam dagangan tetap. Kerana saya tidak berpendapat semua strategi yang diterangkan dalam blog olymp trade boleh digunakan pada setiap mod dagangan olymp.
Contohnya, penunjuk trend boleh digunakan untuk mod forex dan saham pada pendapat saya. Dan penunjuk dengan purata bergerak boleh digunakan untuk kedua-dua FTT dan forex.
Strategi “jurang” sangat bagus dalam mod tetapi juga. Kerana jurang ini biasanya ditutup dalam beberapa minit selepas pasaran dibuka.
Jadi cublah strategi yang disediakan olehmp trade, dengan akaun demo, faham di mana lebih cekap untuk menggunakannya.
Saya rasa penunjuk ini berpotensi menjadi sangat efektif dalam keadaan tertentu. Baguslah ia tersedia di platform Olymp Trade.
Tapi, saya tak dapat tentukan bagaimana untuk menggunakannya. Penunjuk apa yang paling berkesan digunakan bersamanya?
Saya rasa bilangan tepat penunjuk tidak penting sangat kerana mungkin ada yang baru ditambah sekali sekala ke platform untuk kegunaan pedagang. Terdapat juga sumber maklumat yang boleh ditemui di platform, di internet dan blog Olymp Trade yang sangat berguna untuk topik ini juga.
Parabolic SAR adalah penunjuk yang agak rumit di antara penunjuk lain di Olymp Trade. Ia memerlukan keseimbangan dalam ketaktentuan. Terlalu banyak ketaktentuan? Tidak boleh dipercayai. Terlalu kurang ketaktentuan? Ia tidak akan berfungsi.
Saya sentiasa suka petua berguna. Ia membolehkan saya berlatih pemikiran bukan standard. Ia juga membantu saya membangunkan pendekatan kreatif untuk menyelesaikan masalah. Kerana itu saya suka artikel tentang perdagangan dengan kandungan seperti ini.
Saya belajar menggunakan SAR parabolik beberapa tahun yang lalu dan ia menjadi sebahagian daripada penunjuk perdagangan yang saya gunakan setiap hari. Baik, saya tak boleh meniput kerana saya tidak belajar menggunakannya di sini. Saya perlu bayar orang lain untuk dapatkan pengetahuan itu.
Jika saya tahu tentang Olymp Trade lebih awal, saya pasti cuba dapatkan pendidikan yang sama secara percuma. Broker ini lakukan terlalu banyak untuk pelanggan mereka dan broker lain juga patut belajar lakukan yang sama. Pendidikan percuma hanya satu daripadanya.
Saya jarang berdagang dengan penunjuk, tapi ini tidak bermaksud saya tidak mencubanya semasa mula berdagang dengan Olymp Trade. Parabolic SAR adalah penunjuk pertama. Saya terus suka platform Olymp Trade, kerana itu saya juga segalanya dengan tepat. Syarikat itu tahu cara untuk memastikan perkhidmatan berkualiti.
Jujur kata, saya sentiasa mengabaikan penunjuk Parabolic SAR kerana ia kelihatan rumit berbanding penunjuk trend yang lain.
Kerana blog Olymp Trade kini saya mahu cuba dalam perdagangan saya.
Parabolic SAR digunakan untuk menentukan arah momentum aset serta titik masuk dan keluar yang optimum untuk dagangan. ia sangat popular di kalangan pedagang, dan ramai broker termasuk Olymp Trade, menawarkannya di platform perdagangan mereka. Saya biasanya gabungkan dengan beberapa penunjuk lain untuk memaksimumkan keuntungan kerana saya dapati sukar untuk mencari titik keluar terbaik dengan sAR.
Ini sama seperti jalur bollinger. Saya rasa cara bagus untuk gabungkan beberapa penunjuk dengan cara yang berguna ialah menggunakan sama ada RSI atau purata bergerak berganda. Cara ini, and aboleh lihat jika dan bila harga berbeza daripada penyimpangan biasa, dan juga jika ia terlebih jual atau terlebih beli.